Whether you’re managing Amazon EC2 instances or writing AWS Lambda functions, AWS X-Ray is a critical distributed tracing tool for getting visibility across your AWS services, but it doesn’t automatically capture all calls outside of AWS.
Conversely, New Relic Distributed Tracing provides automatic tracing for any application where the New Relic agent is installed—including on-prem and monolithic applications. One thing it lacked was visibility into trace and performance data from AWS-managed services where the agent couldn’t be installed.
Now, you can combine New Relic Distributed Tracing and AWS X-Ray into a single, seamless experience. Automatically see an end-to-end view of requests as they travel through their applications, along with filtering, querying, and visualizing trace data to quickly debug issues.
This update brings rich trace data for AWS-managed services so you can get insight into how services—like AWS Lambda, Amazon Simple Queue Service, Amazon API Gateway, or Amazon DynamoDB—are contributing to your total transaction time or possibly causing errors.
Get started
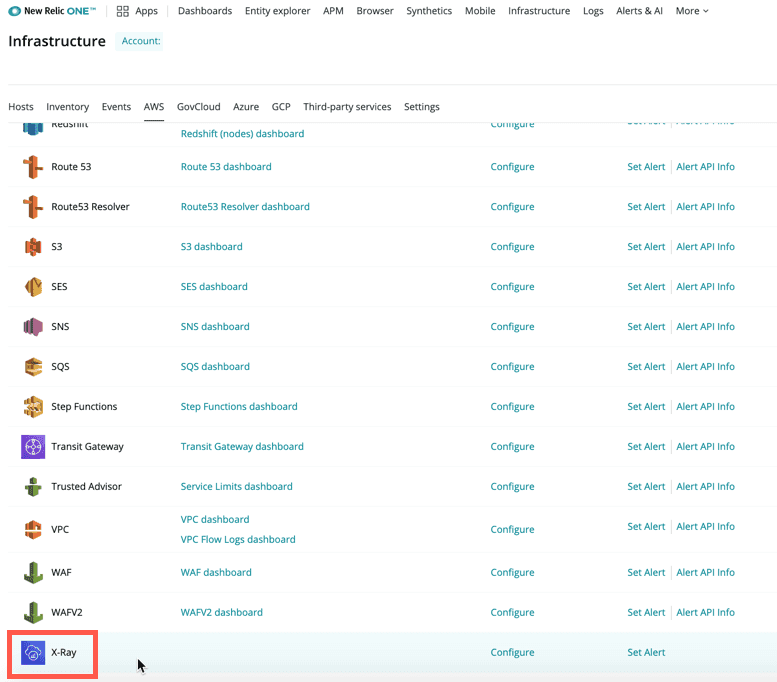
If you’re an existing New Relic user and you’ve already connected your AWS account, go to your New Relic Infrastructure AWS settings and activate X-Ray (see below).
After you enable the X-Ray integration, AWS X-Ray trace data will automatically display in any distributed tracing view throughout New Relic One.
Suggest a change and learn how to contribute
